01/2026
AI Products
Flatvalue | Finance
Follow apartment asking price development and price drivers based on listing sites
What is it about?
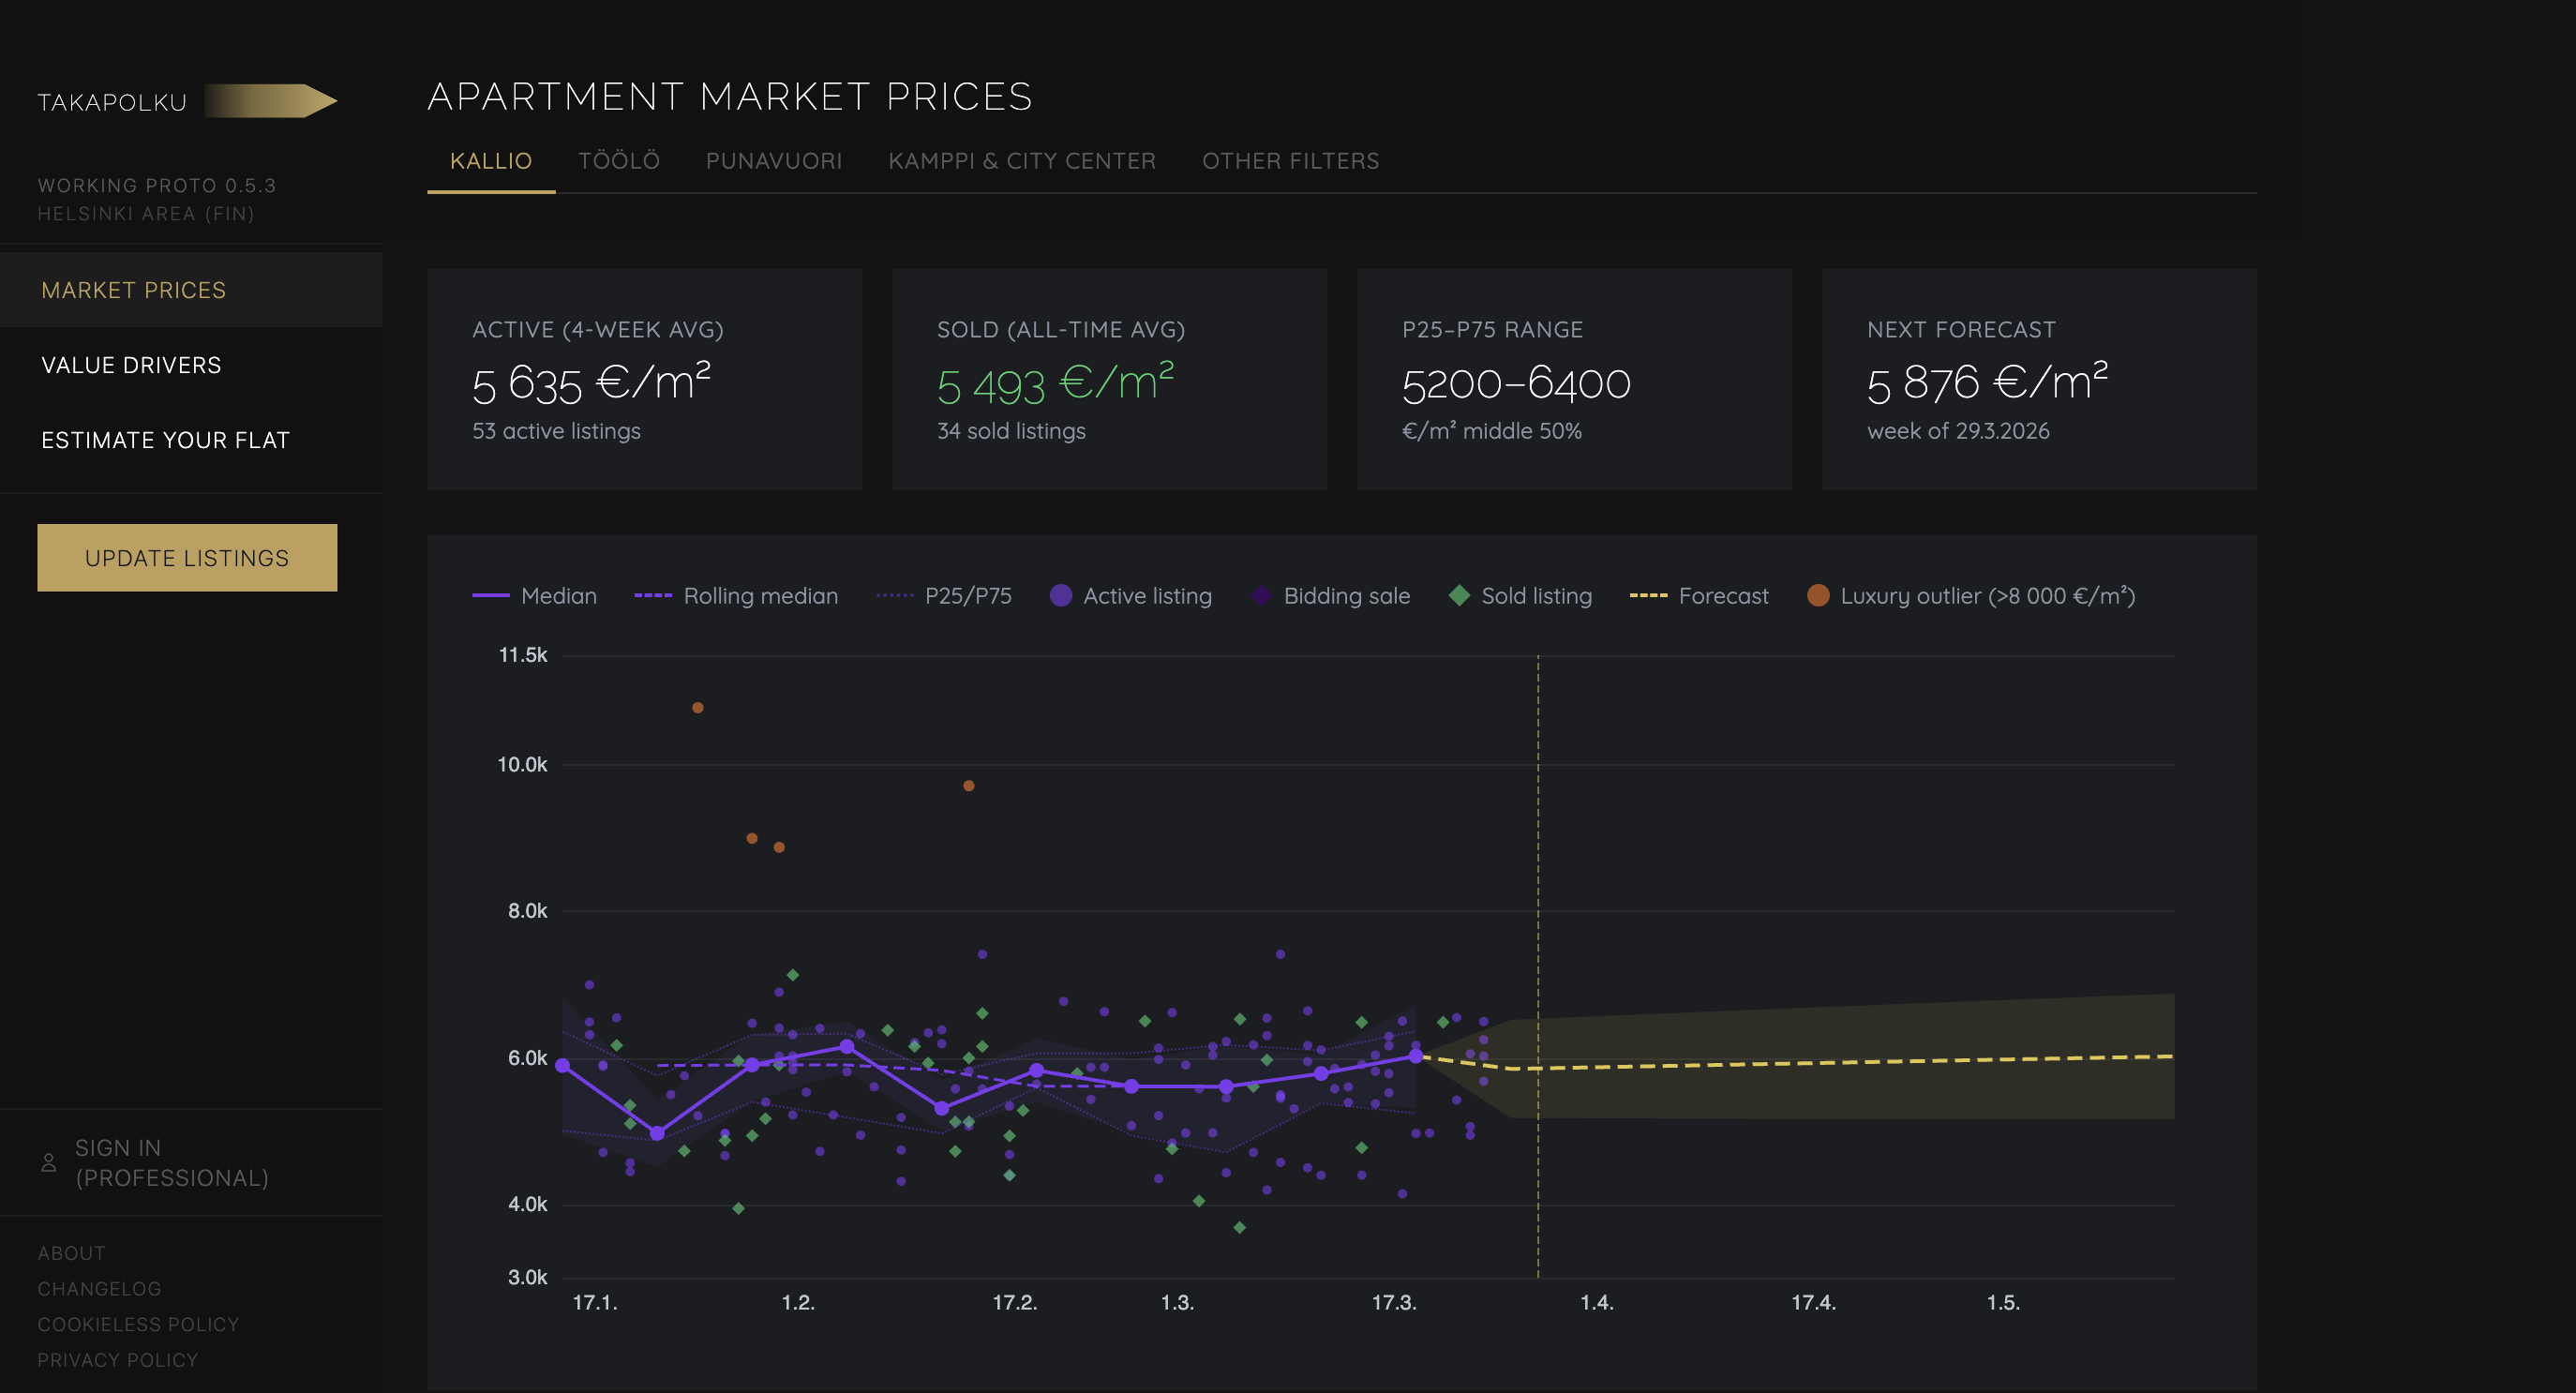
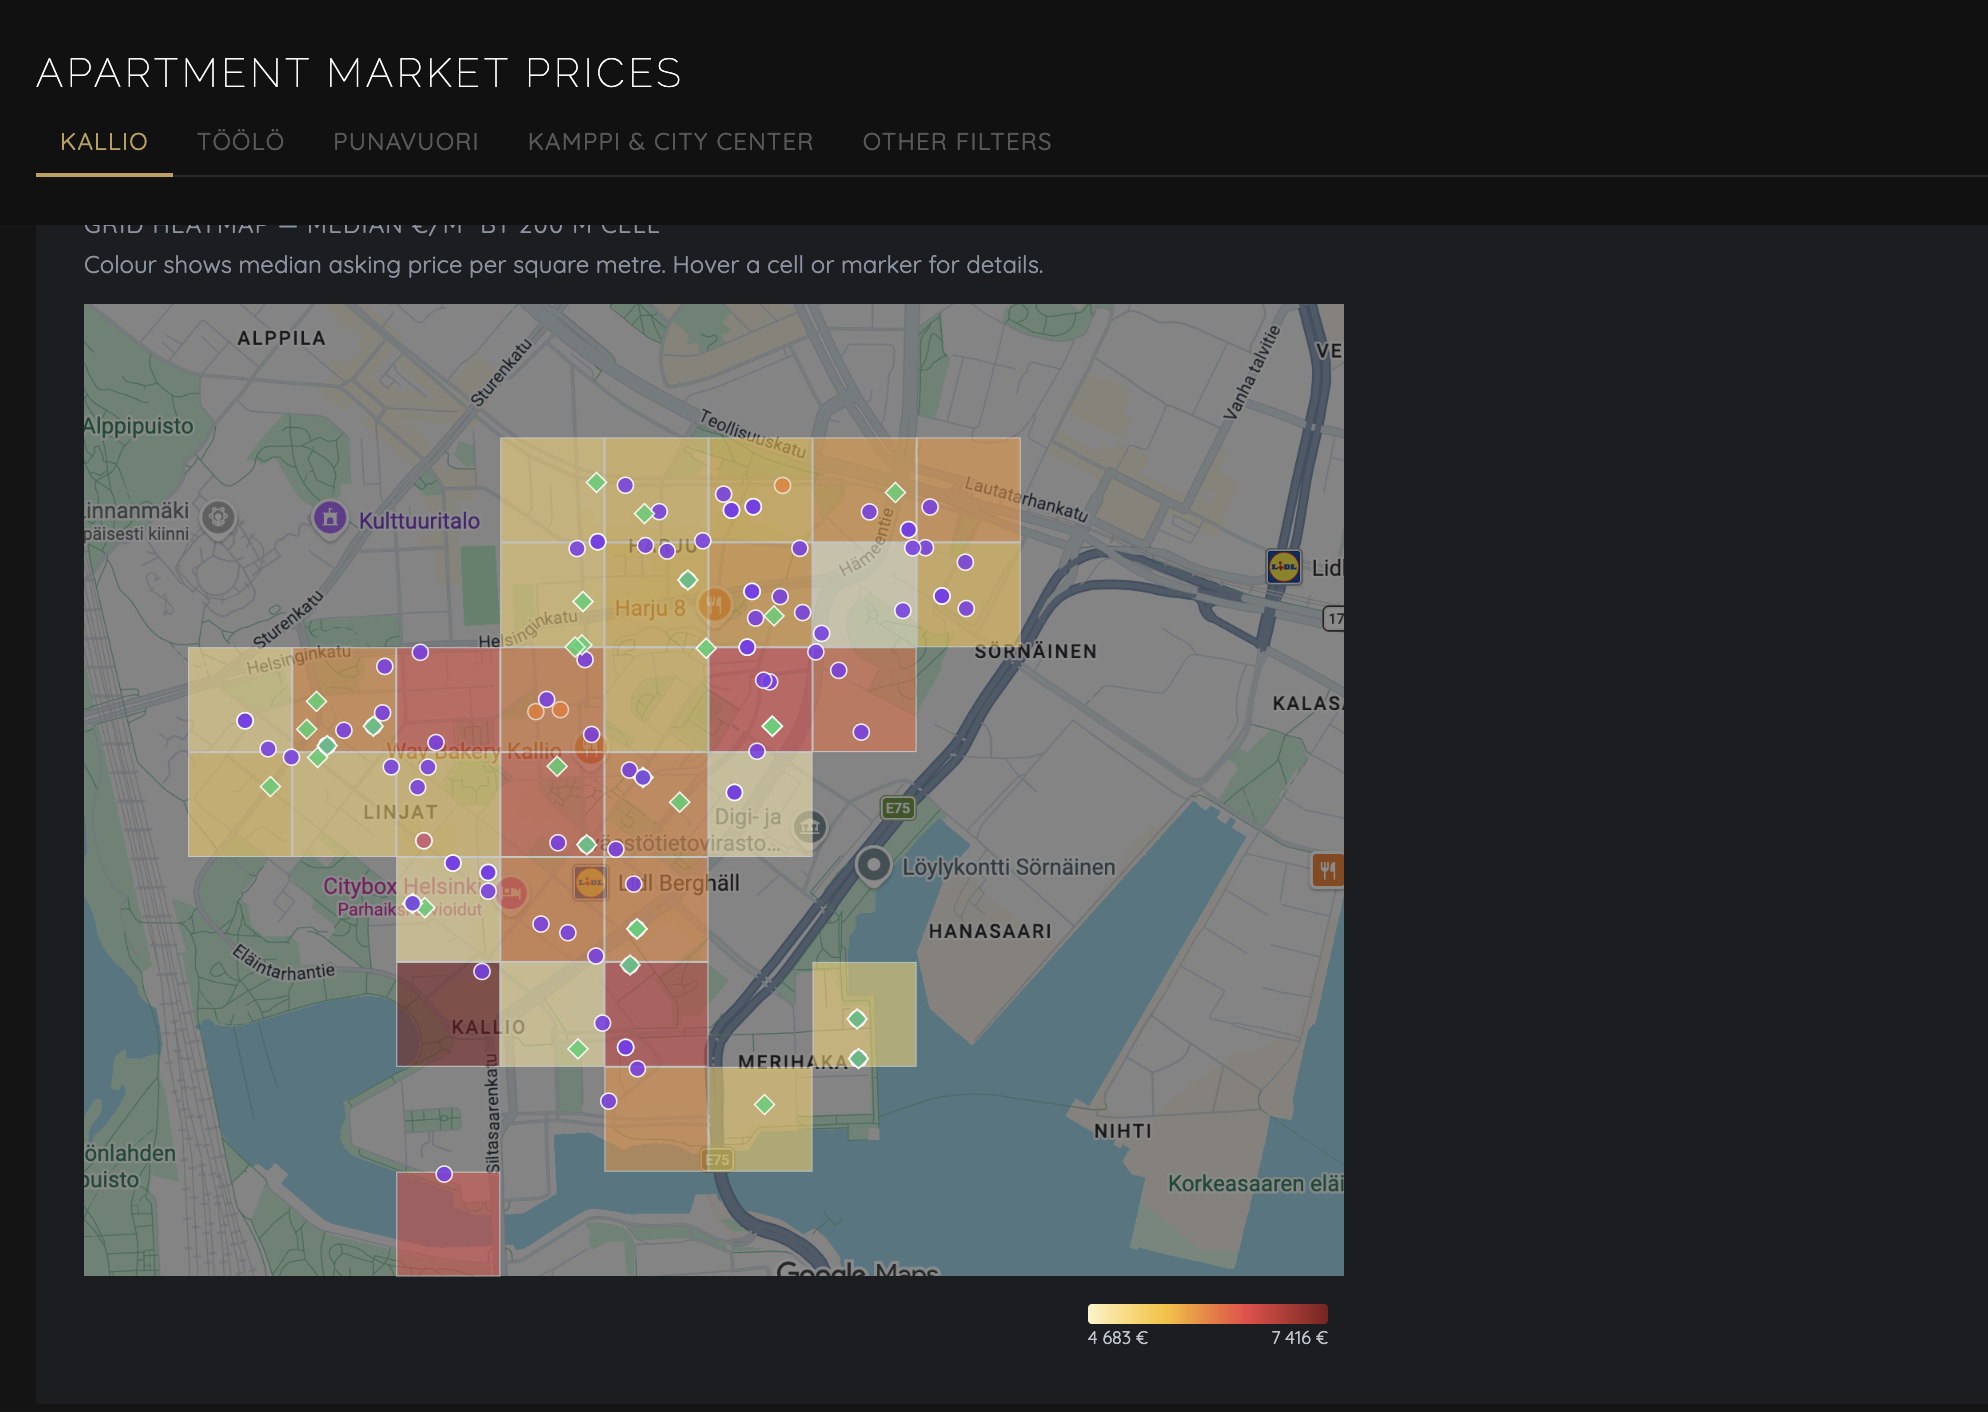
Apartment listing price tracker for Kallio and Sörnäinen (in Helsinki). Scrapes listing data from Oikotie, analyses price trends and what drives them, and estimates apartment value based on features.
Try it live at: flatvalue.saviranta.com
- Price estimator: input your apartment, get a data-driven estimate
- Market view: price index over time with confidence intervals
- Price drivers: what features actually move the price in this market

Why I’m building it?
To solve a problem I have: when to sell. For me the trend and its development is key.
I learned a lot about MCPs, scraping, parsing, turning quali-data to meaningful statistics etc.
How am I building it?
Python data pipeline on PostgreSQL — ingests Oikotie listing, scrapes and parses listing details, runs the analysis. The analysis design (Ridge regression, clustering, price index with bootstrap CI) I did myself, AI coding agents handled the implementation.
The web app reads and renders the pipeline outputs. Model weights exported as JSON, committed to repo, triggers a redeploy automatically.
What’s my goal?
- Have a reliable tool for my own apartment decisions.
- To see if it sparks interest in others
Tech Corner
// STATUS ──────────────────────────────────────────────────────
pipeline active | web app deployed, content pages pending

lines_of_code: 19200   |   launch_estimate: 85%

// PIPELINE ────────────────────────────────────────────────────
approach        deterministic Python pipeline + Next.js web app

deterministic   everything — scraping, parsing, enrichment,
                analysis, rendering; no LLM in pipeline

llm             Claude Code for pipeline orchestration;
                no LLM in the data pipeline itself —
                Ridge regression (R²=0.25, n=68) for price
                estimation; weights exported as JSON,
                committed to repo, triggers app redeploy

reasoning       apartment prices follow statistical patterns;
                deterministic = cheaper, reproducible, debuggable;
                LLM adds cost and variability where math works

// HUMAN IN THE LOOP ───────────────────────────────────────────
where           pipeline runs are user-triggered; false doors
                (contact form, premium report) require manual
                follow-up on conversion signals

why             pipeline is a data tool — user decides when
                to refresh and how to act on what it shows

// EVALUATION ──────────────────────────────────────────────────
how             Ridge R² tracks model quality; bootstrap CI
                quantifies uncertainty on price index;
                PostHog session replay + events for false
                door conversion rate tracking

traces          22 DB migration files track schema evolution;
                analysis tables pushed to Supabase; model JSON
                commit triggers Vercel redeploy — audit trail

// CONTEXT ─────────────────────────────────────────────────────
approach        none — no LLM in the pipeline

why             deliberate; statistical models are fully
                explainable and have no context window,
                hallucination risk, or per-call API cost

// INTEGRATIONS ─────────────────────────────────────────────────
gmail_mcp       reads Oikotie alerts from email to seed scraping;
                MCP avoids building Gmail OAuth from scratch

supabase        sync layer — pipeline pushes, app reads and renders

upstash_redis   rate limiting (5 req/min on estimate API);
                serverless-compatible, persists across deploys

posthog         session replay + false door event tracking

// OTHER TOOLS ──────────────────────────────────────────────────
playwright      vs requests — Oikotie renders with JS;
                needs a real browser to get listing data

hdbscan         vs k-means — no fixed k; handles outliers
                naturally; fits uneven cluster sizes in real data